Hi Everyone,
This week I provide a review of Taiwan Semiconductor’s Q4 2020 earnings. I am ramping up my learning curve in the semiconductor industry and learning about one of the most important companies in the space is a good start. Similar to my process with AI, I will also be building out a primer so you can all get up to speed with me. You can read this post on my website if you would like.
If you missed my post on Twitter, I am moving the newsletter to a freemium model. You will have to subscribe again, to the paid version, if you would like to be a paid member. The benefits of being a paid subscriber:
Monthly stock deep dives
Access to all detailed reports and full archive
Subscriber-only newsletters and posts
Virtual AMAs
Please make sure to share this newsletter, share this post, or subscribe (if you have not already) if you like the content! You can use the buttons here to do so:
DISCLAIMER:
All investment strategies and investments involve the risk of loss. Nothing contained in this website should be construed as investment advice. Any reference to an investment's past or potential performance is not, and should not be construed as, a recommendation or as a guarantee of any specific outcome or profit.
Fiscal Year Q4 2020 Overall Earnings Summary
We are in the middle of yet another earnings season. I wanted to take the opportunity to provide some insights and takeaways from the earnings reports of some companies that have already reported. Please feel free to comment on any other companies you would like me to cover.
FactSet Earnings Insight provides an update of the earnings season every week. Accordingly, as of February 5, 2021:
For Q4 2020 (with 59% of the companies in the S&P 500 reporting actual results), 81% of S&P 500 companies have reported a positive EPS surprise and 79% have reported a positive revenue surprise. If 81% is the final percentage, it will tie the mark for the second-highest percentage of S&P 500 companies reporting a positive EPS surprise since FactSet began tracking this metric in 2008.
FactSet Earnings Insight, February 5, 2021
Given the proportion of companies beating EPS and Revenue estimates, we can infer that sell-side estimates were either: 1) stale, 2) overestimated the negative impact of COVID, or 3) underestimated the tailwinds in certain industries. To get us situated, the chart below reflects the change in the S&P’s Forward EPS and overall price. Note: I recognize the issues with the scales of the graph, so please don’t draw immediate conclusions from the visual.
While you cannot make accurate inferences from this graph, the chart below from Yardeni Research shows evident growth of the Forward P/E from a year ago. It’s difficult to make any direct takeaways from the Forward P/E because, by definition, the denominator is an amalgamation of estimates. To state the obvious, COVID brought about much uncertainty. The elevated Forward P/E here may simply be a result of extremely conservative analyst earnings estimates.
Yardeni measures the Forward 12-month P/E ratio at 22.1x. This is above the 5-year (17.6x) and 10-year (15.8x) averages. However, it is below the 22.4x Forward P/E measured at the end of Q4 2020. Your visceral analysis may be that the market is currently extremely overvalued. However, I would caution against this assumption. While certain pockets of the market are certainly demonstrating irrational exuberance, you have to look under the hood to get a better picture of underlying market dynamics. I don’t think an average is appropriate for market-wide metrics given the non-normal (in the market’s case, negatively skewed) distribution and dependent nature of variables. While an average P/E is a nice heuristic, we should all be aware of the pitfalls when relying on heuristics. For our purposes, it is a simple way to summarize the market.
Taiwan Semiconductor Manufacturing Co., Ltd. (NYSE: TSM) Earnings Review
Taiwan Semiconductor Manufacturing Co. (“TSMC” or “TSM”) reported earnings on January 14th, 2021. While I could write multiple newsletters on just this earnings report, let alone the company, I will try to keep each of these takeaways brief.
Business Description
TSMC was built by Morris Chang as the first “pure-play” foundry after he was passed over for the CEO role at Texas Instruments. I will discuss chaos theory and the “butterfly effect” in a separate newsletter, but this a fine example of this phenomenon. A foundry is a manufacturing or “fabrication” plant. Prior to the creation of TSMC, semiconductor companies both designed and manufactured their chips. However, this model required significant capital investment and hindered the pace of innovation as the manufacturing component of the business consumed the majority of a company’s resources.
Enter Morris Chang. The fabrication-only (“pure-play”) model was, in my opinion, a critical inflection point for the industry. It spurred the development of a new industry consisting of “fabless” companies. Fabless can be thought of as “design-only”; they could expend resources on design and innovation rather than the high fixed costs of running a plant. These fabless companies are TSMC’s customers, which is a great model since the fabless companies know TSMC is not competing with them. TSM has become the leading global contract chipmaker after surpassing Intel in 2019. TSM controlled ~53% of the nearly $70B third-party fabrication market as of January 2020 according to TrendForce. Meanwhile, Samsung (18%) and GlobalFoundaries (spun-off from AMD, 8%) make up a distant second and third.
There are not enough superlatives to describe TSMC, so let’s dive in to its Q4 2020 earnings report.
Main Takeaway – Capital Expenditure Guidance
This was the biggest takeaway and most bullish of the report. The company guided to $25B-$28B of expenditures for 2021 against consensus estimates of $21B and 2020 spend of $19B. This was a 26% increase over consensus and represents a growth rate of nearly 40% YoY at the midpoint. As a matter of clarification, TSMC’s CapEx spend is revenue for wafer fabrication equipment (“WFE”) companies. The company wouldn’t confirm that this increased guide related to an expectation of onboarding more volume from Intel. However, a TrendForce report confirmed such (emphasis mine):
Intel has outsourced the production of about 15-20% of its non-CPU chips, with most of the wafer starts for these products assigned to TSMC and UMC, according to TrendForce’s latest investigations. While the company is planning to kick off mass production of Core i3 CPUs at TSMC’s 5nm node in 2H21, Intel’s mid-range and high-end CPUs are projected to enter mass production using TSMC’s 3nm node in 2H22.
http://www.trendforce.com/presscenter/news/20210113-10651.html
Leaving aside the geopolitical implications of this outsourcing, this decision by Intel will benefit both companies for the foreseeable future. Turning back to TSMC, one aspect of the CapEx guide is the increasing intensity of equipment for leading-edge technologies. Viscerally one would think simply of the increased CapEx spend eating free cash flow that would otherwise be available for reinvestment. To the contrary, the ramp in CapEx spend is to develop leading process node technology and maintain its technology and innovation leadership. Below is a chart of CapEx spend trends put together by the great Mule’s Musings. CFO Wendell Huang shed light on the historical context of this increased spend (emphasis mine):
Next, let me talk about our capital intensity outlook. As we have said previously, our long-term capital intensity is in the mid-30s percentage range. However, when we enter a period of higher growth, our capex needs to be spent ahead of the revenue growth that will follow, so our capital intensity will be higher. For example, during 2010 to 2014, our capex spending increased threefold as compared to the previous few years and our capital intensity range between 38% to 50%. Because of the increased investment, we were able to capture the growth opportunities and deliver above 15% growth CAGR from 2010 to 2015. Today, as we enter another period of higher growth, we believe a higher level of capacity — capital intensity is appropriate to capture the future growth opportunities. We now expect a higher growth CAGR in the next few years, driven by the industry megatrends of 5G and HPC-related applications, which C.C. will discuss in more detail.
TSMC Q4 2020 Earnings Call Transcript
Sources of Revenue – Technology and Platform Mix
I was blown away by how quickly TSMC has ramped 5nm (“N5”) production and shifted its revenue mix from 7nm to 5nm. The company generated 20% of its sales from 5nm tech in Q4, up from only 8% in Q3. Overall, advanced process technology, consisting of wafer technologies 16nm and below, comprised 62% of total revenue vs. 56% in Q4 2019. The company’s customer base of leading fabless companies, and now IDMs (Integrated Device Manufacturers), includes the likes of A-players such as AMD, Apple, Alphabet, Amazon, Microsoft, Facebook, NVIDIA, and Qualcomm. These companies are the leaders in cutting-edge tech and behind the acceleration in demand for TSMC’s 5nm and sustained demand for 7nm tech. As a final note, the company alluded to the fact that they are actually ahead of schedule when it comes to 5nm (more on this below).
Diving into the platforms driving demand for TSMC’s products, the Q-o-Q growth in automotive (+27%) and digital consumer electronics (“DCE”) (+29%) is staggering. Smartphones (a market Intel missed, contributing to its fall from dominance) showed continued strength, while high-performance computing (“HPC”) decelerated but remains a substantial part of the business. It seems that Apple’s in-house chip design may be a driver behind TSMC’s continued success in the Smartphone market, but also the reason for 5nm being ahead of schedule. Moving forward, the company expects HPC and Auto to be the main revenue drivers in 2021. Relating to HPC, “we see a stronger innovation is coming our way on N3 as well as on N5.” Additionally, N3 (3nm) volume production is targeted for 2H 2022. This next node will remarkably have a 70% logic density gain, up to 15% performance gain, and up to 30% power reduction compared to 5nm. Below I’m going to explain just how incredible their 3nm tech is.
Technology Leadership and the Path Forward
Improvements in 3nm Technology
As a reminder, TSMC expects full volume production of 3nm chips in 2H 2022. The company expects its 3nm node will contain roughly 250 million transistors per square millimeter of silicon. I’m going to stop here for a second so everyone can recognize how patently absurd this is. Please grab a ruler and look at the centimeter side; the distance between each hash is one millimeter. So let me repeat, they are able to fit 250 MILLION transistors in that space… WHAT?! If that wasn’t ridiculous enough, I’ve seen some estimates state that 3nm may have 300MM transistors / mm2. The technological capabilities of these semiconductor companies never cease to amaze me.
This level of transistor density is at least 2.5x-3.0x times denser than Intel’s latest 10nm node (100MM transistors/mm2. Additionally, TSMC’s most refined 7nm and 5nm tech have 113 million and 175 million transistors per square millimeter, respectively. The implication for GPUs is remarkable, from the article (emphasis mine):
That density can be used to either make chips with existing complexity much smaller and therefore a little cheaper, or enable much more complex designs. Such is the way with computer chips, so long as the likes of TSMC keep developing new nodes.
But just think about it. AMD’s Navi 21 GPU, the chip inside the Radeon 6800 and 6900 Series boards, clocks in just under 27 billion transistors using 7nm. So a 3nm GPU of the same size could pack around 80 billion transistors if they really pushed it.
Please push it TSMC, push it real good.
Technology Pipeline
TSMC’s status as the leading third-party manufacturer is a relatively new phenomenon. Gavin Baker wrote about Intel losing its manufacturing lead to TSMC in 2018/2019 in this brilliant piece two years ago (it’s a quick read and highly recommended). The company’s CapEx plan and positioning as the fab of choice for leading design companies (and IDMs) may further entrench TSMC as one of the most important companies in the world (I personally believe ASML wears this crown). The 3nm tech for logic chips is assuredly the next step, but don’t lose sight of the fact that advancements in node technology are being made across the board.
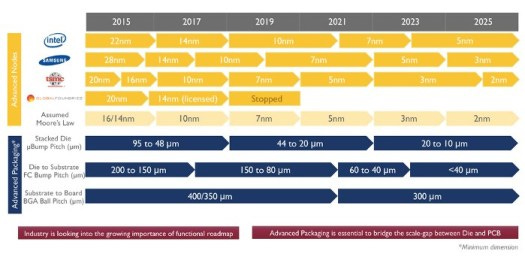
Juxtaposing TSMC’s progress against its three main competitors illuminates its positioning as the leading chip manufacturer. Remember that the indications of nodes in the graph below (i.e. 7nm, 5nm, etc.) no longer represents the transistor gate length, but is more a marketing tool now. Notwithstanding, notice how GlobalFoundaries (GF) is no longer pursuing nodes past 14nm. Similar to how Nokia gave up trying to develop EUV photolithography technology (ASML!), GF sort of threw up its hands and gave up trying to keep pace. The last point here illustrates that our ability to track Moore’s Law is at least slowing. Advanced packaging technologies will continue to drive the industry forward (more on this in an eventual Primer on Semiconductors).
Financials Summary
I am not going to spend too much time talking through the company’s actual financial results, but I wanted to at least give you all an update on how the company has been performing.
Income Statement
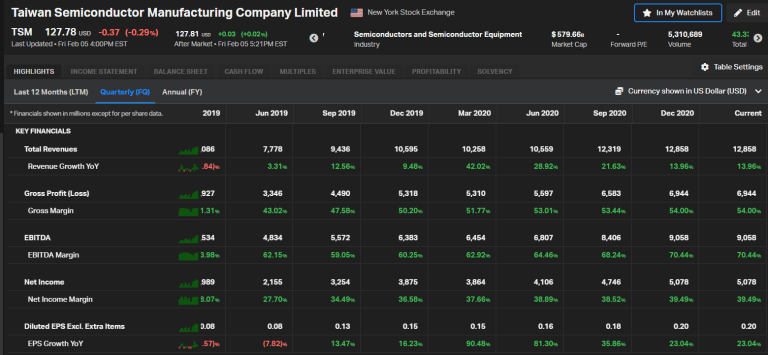
Looking at the quarterly IS may lead one to believe the company is experiencing decelerating sales growth. However, notice the seasonality of TSMC’s revenue. That’s why I have also included the T12 Income Statement which shows a continued acceleration of revenue growth. Gross Margins remain strong and above the company’s 50% long-term target. EBITDA and Net Income margins have followed suit, reflecting the benefits of operating leverage and scale. Three consecutive quarters of TTM EPS growth in excess of 40% provides further confirmation the industry has entered a cyclical bull market.
Balance Sheet
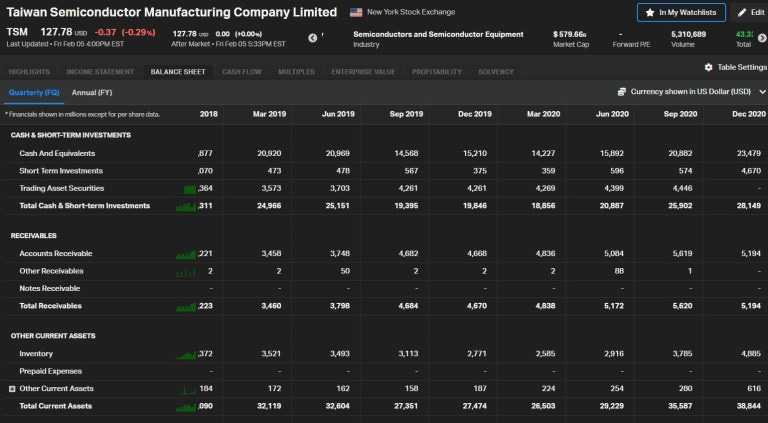
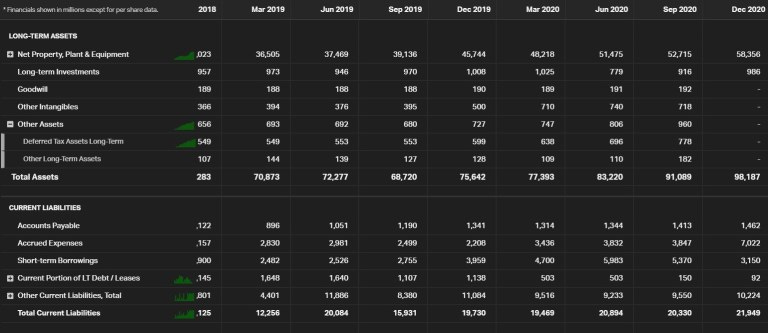
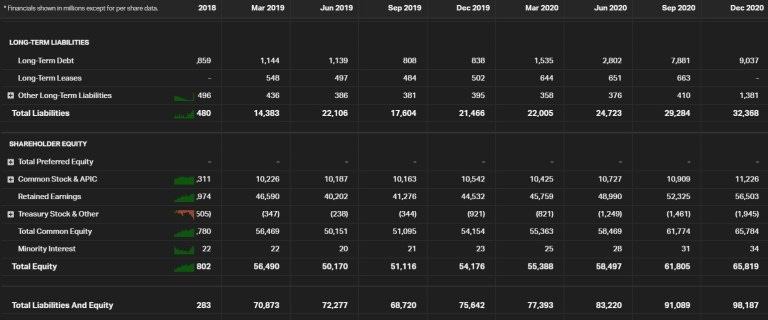
I usually like to synthesize Balance Sheet discussions by looking at efficiency, liquidity, and solvency ratios. Of note, ratio analysis isn’t entirely helpful without industry comps as a benchmark since every industry is different. But for this exercise, we can utilize some rules of thumb.
Efficiency (or Activity) ratios measure a company’s ability to utilize its resources to generate revenue. The higher the ratio, the more efficient a company is at utilizing its assets. The calculation is simple, Revenue / Average [Balance Sheet Item]. So, Accounts Receivable Turnover is Revenue / [(Beginning AR Balance + Ending AR Balance)/2]. Speaking of AR Turnover, TSMC’s AR Turnover has been increasing over the past couple of quarters.
Liquidity ratios measure the company’s ability to meet its short-term (defined as the greater of one year or operating cycle) obligations. Liquidity has increased over the past couple of quarters as well, indicated by rising current and quick ratios. Additionally, cash from operations (discussed below) divided into current liabilities has been increasing, as well. This latest metric measures a company’s ability to generate cash from core operations to fund short-term obligations.
Solvency ratios measure the company’s ability to meet its long-term obligations. While debt levels have been increasing overall, the company is still extremely well-capitalized given its total debt/equity capital sits below 20%.
Overall, the company has a healthy Balance Sheet.
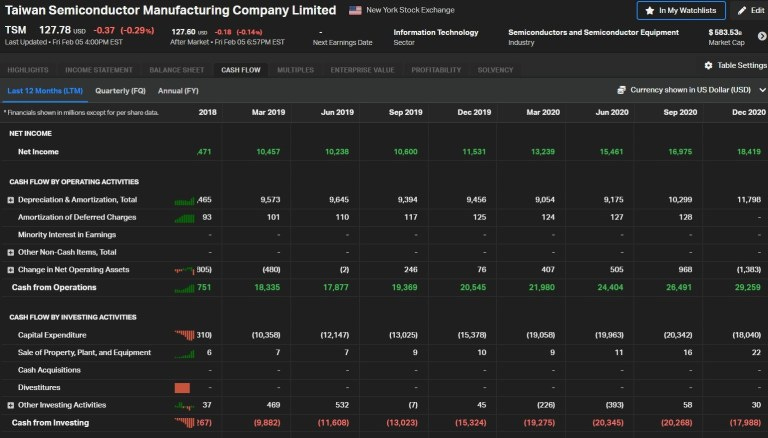
Cash Flow Statement
The Cash Flow Statement is relatively straightforward so I will save you all the time of me stating the obvious. One thing to note when looking at the CFS is that TSM is consistently generating positive levered free cash flow (FCF to the firm). This is can be seen by the fact that CFO is consistently greater than capital expenditures. Excess free cash flow can be utilized for either reinvestment back into the business or returned to shareholders. More free cash flow creates more value.
Conclusion
Taiwan Semiconductor Manufacturing Co., Ltd. is one of the most important companies in the world, as it has become the leading third-party semiconductor manufacturing contractor in the world. The biggest (positive) surprise from the company’s Q4 earnings results was its capital expenditure guidance for 2021. By forecasting spend between $25-$28B (+40% YoY at the midpoint), which the company explained is a necessity given the expected increase in demand. Speaking of the increase in demand, we have learned that Intel will continue outsourcing certain manufacturing capabilities to TSMC. The company has rapidly accelerated its 5nm process technology sales, indicated by its growth in revenue mix from 5% in Q3 2020 to 20% in the most recent quarter. TSMC should continue its technology leadership by focusing on advanced packaging and beating its two main competitors (Samsung and Intel) to the next node.
While I have a lot more to learn about TSMC and the overall semiconductor landscape, I hope this overview of TSMC’s Q4 2020 earnings can serve as a piece of the mosaic in understanding the company and industry.


