Kulicke & Soffa (KLIC) - Investment Pitch and Analysis
Part I: Packaging Leader to Benefit from Equipment and Chip Shortage
Hi Everyone,
*This is Part I of II for this report. It was too long to send as one newsletter. This Part I will contain the core investment analysis and company analysis. Part II will contain a full industry overview. I caught some issues when transferring the post from my website to substack. You can read the post on my website to mitigate any chance I missed something and not have to look at two different emails.
Since I sent out the initial executive summary on Kulicke & Soffa back on March 26th, the stock has appreciated 16.8% even after the 3.51% down day today. I have no clue why it moved so much, so fast - but the initial thesis appears to have been correct: the stock had 20% upside if the market just realized the consensus estimates. Good news - there was plenty more to the thesis and the stock still has plenty of upside. I have updated the financial model - please feel free to view it at your leisure. I reference it throughout the financial analysis.
Big shoutout to Mule on Twitter for introducing me to KLIC. Of course, I did my own extensive research, but it would have probably been under my radar without his tip. Speaking of research, there is no way I could have completed the level of rigorous research without Tegus. Tegus provides a library of transcripts of expert calls and even allows you to make your own calls as a paid subscriber. While this is more of an institutional tool, the quality of my research improved exponentially by using their platform. They are not a sponsor of any sort, but I wanted to give them the appropriate acknowledgment.
Please make sure to share this newsletter, share this post, or subscribe (if you have not already) if you like the content! You can use the buttons here to do so:
DISCLAIMER:
All investment strategies and investments involve the risk of loss. Nothing contained in this website should be construed as investment advice. Any reference to an investment's past or potential performance is not, and should not be construed as, a recommendation or as a guarantee of any specific outcome or profit.
Executive Summary
Company Overview
Company Name (Ticker): Kulicke & Soffa Industries, Inc. (NASDAQ:KLIC)
Market Capitalization/Price*: $3.5B/$56.20 (62.1MM shares O/S)
Business Model/Product Lines: General Semiconductor and Other Electronic Assembly Equipment
*Market Close 04/08/2021
Fundamentals (LTM & Q1’21; FY 2021 Consensus/Forecast)
Revenue: $746.7MM LTM (+42% YoY) & $267.9MM (+86%); $1.11B (+78%) / $1.17B (+87%; 5.4% beat)
Diluted EPS: $1.39 (+408%) & $0.77 (+266.7%); $3.20 (+286%) / $3.55 (+328%; 10.9% beat)
Free Cash Flow: $85.6MM & $38.7MM; $163MM / $190.9MM (16.3% Margin; 17.1% beat)
Valuation
P/E: LTM – 22.9x; YTD – 18.2x; Forecast: 17.5x on NTM Earnings – $66.50 (+18.33%)
EV/EBITDA: LTM – 13.5x; YTD – 12.3x; Forecast: 11.5x on NTM EBITDA $293.07 – $62.42 (+11.1%)
Price-Implied Expectations (“PIE”): Consensus – $56.74 (+0.9%); High – $59.44 (5.77%); Low – $54.48 (-3.1%); Forecast – $74.19 (+32%)
Differentiated Perspective
Kulicke & Soffa has at least ~20% upside from here, even after its 27% run over the past two weeks since I issued the original recommendation. This opportunity results partially from a behavioral opportunity in the market, an anchoring bias, as the price has not caught up to the new base case operating performance. An under-investment in back-end technologies over the past several years has led to a rapid pick-up in demand for KLIC’s products, resulting in 6-9 months lead time for its equipment and estimated visibility through mid-2022. This increased visibility is a new paradigm for the company and will lead to revenue beating consensus. Additionally, estimates have not adjusted for operating leverage inherent in the updated business model. The key value factor for KLIC is volume, followed closely by operating leverage and price & mix.
Thesis
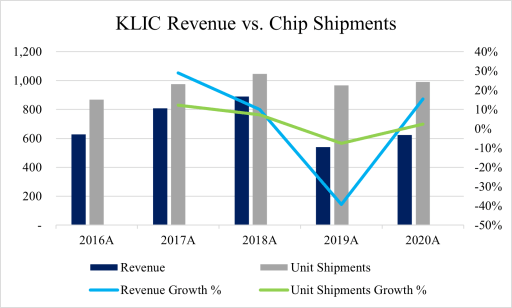
1. Chip Shipment Volumes: Kulicke & Soffa’s business is highly levered to global IC unit shipments, given that 75-80% of chip packages are wire-bonded and KLIC has ~60% market share in wirebonding. In the short term, the current wirebond shortage is expected to persist throughout 2021 and into 2022. The industry updated its estimate to 13.4% growth in unit shipment volume in 2021; meanwhile, the consensus is underwriting 12% growth (in line with management estimates). None of this accounts for a growing backlog of orders, which grew by $144MM in Q1 alone and represents purchase commitments within the next 12 months. This figure will grow due to the aforementioned lead times and commentary from big customers that more orders are coming.
– Falsifiable Thesis: Semiconductor chip shipment growth trending towards 13.5% YoY is the critical factor; if periodic shipment volume isn’t available, fab utilization greater than 90% can be used as an appropriate proxy. Additionally, another catalyst will be FY 2021 Q4, when instead of the typical seasonality, the company reports another $300MM revenue quarter resulting from the backlog. This would be a 21% beat over the $247.9MM consensus.
2. Operating Leverage: The company’s step-wise, sustainable increase in its revenue base has created operating leverage that we started seeing in FY 2021 Q1. The company’s current business model conservatively revolves around a $1B revenue run rate and 20% operating margin; however, the “next iteration of the business model” will reflect a $1.2B revenue baseline and ~25% operating margin. However, the consensus is projecting flat $1.1B revenue on 18-20% operating margin. The Company’s high degree of operating leverage yields high incremental margin flow-through.
– Falsifiable Thesis: Book-to-Bill ratio greater than 1.0 is the critical factor. A ratio above one indicates business expansion and will confirm the thesis that OSATs and fabs are urgently expanding capacity. Meeting $300MM revenue guidance with greater than 20% operating margin in both FY 2021 Q2 & Q3 should cause the market to start pricing in the base-case at a minimum.
3. Price and Mix: Higher volumes are not the only cause for sustained margin expansion. Within wirebonding, ~40% of the Company’s shipments support multi-die packaging and 38% of all equipment sales support advanced packaging. The greater share of these more advanced packaging techniques represents incremental revenue and margin. In the long-term, higher margins will ensue as the product portfolio tilts towards advanced packaging equipment, the miniLED business gains traction, and incremental APS revenue falls through with a higher gross margin. These drivers should start presenting in mid-to-late 2022. Industry participants are noting price increases, a logical result of the equipment shortage and extensive lead times. While K&S has historically passed on these “savings” to its customers, this provides further upside in the near term.
– Falsifiable Thesis: An order backlog increasing above $272MM, representing continued tightness in the market, is the critical factor. Updates from industry participants should confirm steady equipment lead times in the near term. The Company’s stated advanced packaging mix % should only improve from 38%.
Risks and Pre-Mortem
Faster Than Expected Market Recovery: The current chip and associated wirebonding shortage put KLIC in a powerful position as its customers are initiating plans to increase capacity. Current and unexpected expansion plans provide revenue stability and upside through at least mid-2022. However, if the OSATs and other service providers pull back plans to expand below what the market is expecting, this will filter down to KLIC and negatively impact expected revenue growth.
Lower Capital Intensity: If its customers demand single-die packaging tools, roughly $100MM of revenue would be at risk (assuming the aforementioned 38% figure goes to 0%). This could occur if customers focus on producing lower-end chips to fill the hole in the market, due to the relative ease and simplicity of producing these chips. The trailing-edge wirebonding business does not carry very high margins; so despite high volumes, dilution in advanced packaging shipments mix would drag down profitability. However, given statements by ASE (the #1 OSAT) and other industry participants, the industry is moving towards more advanced packaging, not away from it.
Semiconductor Cyclicality: The semiconductor industry is historically cyclical and KLIC’s operating performance is highly dependent on these cycles. If unit shipment volumes grow less than 6.5% this year, the company’s profitability would follow suit. However, in the medium-term, the industry shortage of KLIC’s equipment provides a strong tailwind with high visibility. Long-term demand across existing and growing electronics end-markets, coupled with structural supply constraints, semiconductor industry growth is expected to be more stable and robust for the foreseeable future.
Geopolitical: While not the base case, rising geopolitical tensions between China and the U.S. (or other major markets) could be detrimental to Kulicke & Soffa’s business given that ~50% of sales are to China.
Summary
KLIC represents an opportunity to capitalize on an anchoring bias in the market. Consensus estimates have not appropriately adjusted to the company’s demonstrated results and guidance, partially a result of historic cyclicality. Additionally, the market is missing the upside inherent in KLIC’s: 1) leadership in advanced packaging, 2) upside in automotive and memory end-markets, 3) exposure to lagging edge technologies that will benefit from the current chip shortage, 4) expected growth in advanced display, and 5) evident operating leverage. The chip and equipment shortage in the market sets the stage for upside revisions through at least mid-2022. The shares have up to ~30% upside based on the base case underwriting. Maintaining an 8% stop loss provides an asymmetric return opportunity.
Other Investment Considerations
Sentiment
Starting with overall market sentiment, the market’s views towards “growth” stocks seems to have shifted over the past week or so. Leading growth stocks are building constructive bases and big tech has been leading the Nasdaq higher. The semiconductor space has been especially constructive, with the sector’s relative strength rapidly improving over the past few weeks. Extending out to longer timeframes, the semiconductor sector has been outperforming other tech sectors such as Internet and Software YTD 2021.
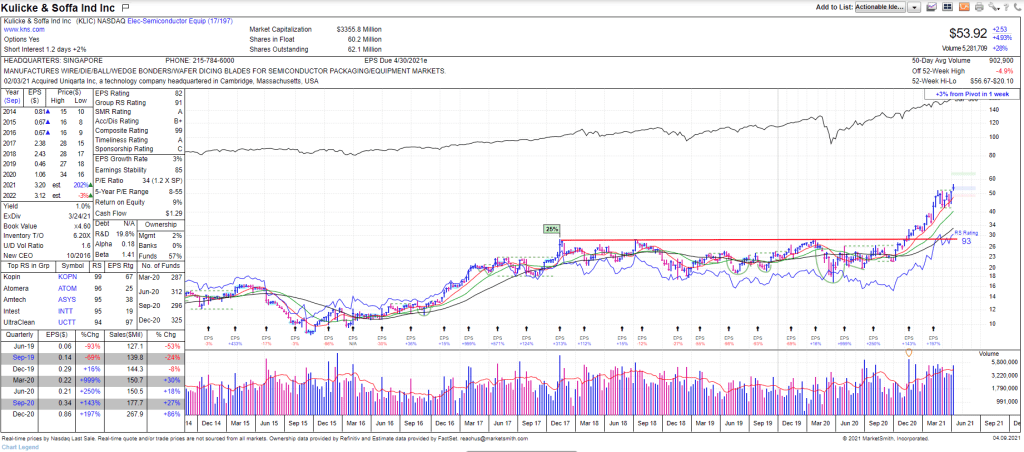
Pivoting to Kulicke & Soffa’s stock, there are only ~1.2 days of short interest and a short interest ratio (“SIR”) of 1.93x. As mentioned in the management section, there has not been a lot of material insider selling as of late. Funds/institutions own roughly 55.5% of the outstanding float, which provides a nice base of support for the stock along with fuel to move it higher. Additionally, more funds have been buying into the stock – 29 more funds have ownership as of Q4 2020 compared to Q3 2020, an increase of 1.8MM shares. K&S has a 93 RS rating (outperforming 93% of the market) which is above the 89 benchmark indication of a strong stock.
TipRanks amalgamated analyst estimates into a centralized location. Only two analysts have provided price targets to TipRanks, which is a data point for why the market has taken longer than it should to adjust towards higher consensus estimates. Craig Ellis from B. Riley Financial has the $69 high price target; Christian Schwab from Craig-Hallum has the low target of $55. The $62 average represents over 14% upside.
Timing
The risk/reward was certainly better two weeks ago when I initially sent out this recommendation. However, the stock is still actionable despite the recent 20% move. The blue shaded bar on the right-hand side of the chart indicates the appropriate range of prices that the stock can be bought with a high probability of success. This range extends up to $55.18, 5% above the $52.55 pivot point. This follows a favorable breakout from a three-year trendline back in November 2020. In my opinion, KLIC has many of the features of a stock market winner.
Short Form Pitch
Kulicke & Soffa is the leader in the semiconductor packaging and electronic assembly equipment market. Market consensus anticipates $1.1B revenue on 20% operating margins for FY 2021, with revenue and margins beyond 2021 flat-to-down. The market is underestimating the duration of the current equipment shortage and associated lead times, as well as the multi-year trend of chip shipment growth. Additionally, consensus estimates are not appropriately accounting for operating leverage inherent in the Company’s business model moving forward. My bottom-up modeling and research results in FY 2021 revenue and margins of $1.2B and 21.5%, respectively. Instead of flat revenue growth and margin compression, the market dynamics will result in top-line growth and continued modest improvements to the Company’s operating margin.
Field research and conversations with experienced industry participants (“expert calls”) reveal three critical factors: chip unit growth, book-to-bill ratio, and order backlog. The catalyst for chip unit growth will occur in early 2022, depending on the availability of unit data. However, the thesis can be tracked by monitoring fab utilization rates above 90%. The catalyst for the book-to-bill ratio is quarterly earnings; however, it requires calls with the Company to obtain. Ensuring a revenue run rate above $1B can serve as a proxy for ensuring the sustainability of operating leverage. Finally, the catalyst for the order backlog is quarterly; the sustainability of a growing backlog can be achieved by tracking equipment lead times through industry participants.
A behavioral bias in the market, specifically an anchoring bias, delayed the market’s reaction to K&S’ new business model and future prospects. While the market has been coming around, mistrust or a misunderstanding in the tailwinds and sustainability of the bull cycle the chip market is in has prevented the market to fully appreciate the stock’s value. The stock has at least 20% upside from here once the market revises its expectations upwards. A more rapid improvement in the chip market’s supply and demand dynamics, muted capital intensity, higher than expected cyclicality moving forward, as well as geopolitical events, pose risk to the stock. However, capping the left tail at 8% losses creates an asymmetric risk/reward opportunity.
Company Analysis
Business Overview
Kulicke & Soffa (“K&S” or the “Company”) is a Semiconductor Capital Equipment (“SemiCap”) company, which designs, manufactures, and sells the capital equipment and tools used in the assembly/packaging process. These products are used to assemble integrated circuits (“ICs”), high and low powered discrete devices, light-emitting diodes (“LEDs”), and power modules – all of which can be defined as semiconductor devices. In addition to the assembly products, K&S also provides die-attach equipment, which are used to connect components to electronic circuit boards. The company also has a business vertical to service, maintain, repair, and upgrade the equipment it previously solid to customers. Its end markets include the global automotive, consumer, communications, computing, and industrial markets. Its interconnect technologies include wire bonding, advanced packaging, lithography, and electronics assembly. K&S competes with other companies in this market based on “price, speed/throughput, production yield, process control, delivery time, innovation, quality, and customer support, each of which contribute to lower the overall cost per package being manufactured.”
These interconnect solutions enable 1) performance improvements, 2) power efficiency, 3) form-factor reductions, and 4) assembly excellence of lagging-edge, current, and next-generation semiconductor devices. The company’s product excellence has made it the leader in flip-chip and other advanced packaging technologies that generate higher margins than traditional packaging techniques. Standard packaging solutions, like KLIC’s wire-bonding, are very much a commoditized product. However, higher volumes of these standard packaging tools do provide operating leverage advantages, which the company states it realizes over $1B revenue run-rates (which it is projecting for FY 2021). To be clear, wire bonding is a component part of some advanced packaging methods, as well. Advanced wire bonding products carry higher capital intensity and provide higher margins; a greater proportion of advanced packaging business is margin accretive for K&S.
The Company’s customer base consists of semiconductor device manufacturers (“fabs”), integrated device manufacturers (“IDMs”), outsourced semiconductor assembly and test providers (“OSATs”), other electronics manufacturers, and automotive electronics suppliers. It follows that the Company’s operating performance is directly related to the capital and operating expenditures of these customers. Thinking through the supply chain, current and expected demand for electronic devices and other products that require semiconductor components indirectly impacts performance – essentially the first derivative of demand. To reduce the number of variables and/or factors to analyze down to a fundamental metric, it is evident that the Company’s business performance is correlated to semiconductor chip shipments. The Semicap industry, including the assembly equipment segment, has been and will continue to be levered to the broader semiconductor industry cycle. Historically, it has been a highly cyclical business prone to boom and bust cycles; demand shocks have previously proved detrimental. It’s my view that this dynamic will persist, albeit more moderately, in the medium-to-longer term; however, the current bullish market environment provides a strong tailwind for K&S.
President and CEO, Fusen Chen, effectively illustrates the current business structure and outlook (emphasis mine):
As we mentioned last quarter, and I discussed earlier, advanced packages and more complex assembly techniques have become material components within our other end-markets. This increase in complexity is largely related to the growth of multi-die packages which provide a cost-effective solution to extend form-factor benefits. This approach helps to overcome the well-known, node-shrink challenges by increasing transistor density at the package level. We anticipate demand and capacity needed for multi-die packages will continue accelerating and will continue to improve the capital intensity of our served markets. Within general semiconductor we estimate over 40% of December sales supported multi-die assembly, which requires more assembly capacity than a typical single-die package. Within Memory, over 60% of our exposure supports stacked NAND, one of the highest-volume and most transistor-dense packages available. Finally, within the LED market, about 50% is associated with advanced display. For the December quarter, we estimate 38% of Capital Equipment sales are supporting more complex, advanced packaging applications increasing the capital intensity of the general semiconductor, LED and memory markets.
Fusen Chen, CEO – Q1 2021 Earnings Call
Business Segments and Revenue Drivers
Kulicke & Soffa generates revenue through the sale of their equipment and tools either directly to customers or through distributors. Revenue from sales to distributors is recognized upon the transfer of control, as it is with customers, not when the distributor resells to its own customers. This revenue recognition policy is established under ASC No. 606, Revenue from Contracts with Customers. The small amount of service revenue is recognized as services are performed. The company provides annual revenue breakdowns by geography, but its reporting methodology organizes its business into two main segments: Capital Equipment and Aftermarket Products and Services. K&S views its Capital Equipment segment through four sub-segments, representing its end-markets (previously five): General Semiconductor, Automotive & Industrial, LED, and Memory. Aftermarket Products and Services represent the consumable spare parts and services component of its core wire bonding business. Up until its FY Q4 2020, K&S had broken out Advanced Packaging as a separate business line. However, beginning FY Q1 2021, it includes Advanced Packaging within General Semiconductor. Separate and apart from these reporting segments, K&S provides guidance in a bifurcated way between 1) Core Business and 2) New Growth Opportunities. I will discuss the Company through this lens, the cash cow and growth generator. This is the appropriate way to discuss the Company’s operating performance because of the difference in growth prospects and margins from each.
Core Business (Cash Cow)
Kulicke & Soffa’s core business can be thought of as “pre-2019 K&S,” with the end-markets shown above combined together. In terms of Capital Equipment, the semiconductor unit-driven business consists mostly of the Company’s wire bonding, wedge bonding, and surface-mount technology (“SMT”) equipment (some niche advanced packaging and prototype equipment is included). This segment also includes general lighting (not Advanced Displace) and baseline Aftermarket Product and Services (“APS”).
The General Semiconductor segment is Kulicke & Soffa’s cash cow; however, the Company also has a growth opportunity given the continued role of wire bonding in advanced packaging. I will discuss the revenue forecast and operating model in the Valuation section below. I expect K&S’ cash cow business to be somewhat insulated from any underlying changes in the space, as industry experts are confident that wire bonding will persist as a core packaging methodology. This applies mostly to lower-end chips and technologies; however, it will also be the packaging option chosen for products that prioritize low cost and efficiency. K&S has historically and continues to maintain a dominant ~60% market share in wire bonding, which accounts for 80% of all interconnect processes. As discussed in the analysis below, the semiconductor industry is experiencing a massive shortage of wire bond equipment, unlike anything the industry has seen in 20 years. This supply and demand imbalance will drive upside in the near term for the Company’s core book of business.
There is a subtlety that is important to understand here. The supply and demand imbalance, which has resulted in a growing backlog and long equipment lead times, coupled with positive semiconductor unit growth has given the Company the most visibility it has had in a long time. This is partially a result of work the company has done to drive organic growth and stability throughout the organization. What does this mean? K&S is now able to give full-year guidance as opposed to the maximum forward guidance of one quarter. From a purely academic standpoint, that would lead to a lower discount rate on the Company’s future cash flows given a lower amount of uncertainty. But this can also be viewed through the lens of market multiples, which will also be covered in the Valuation section.
Kulicke & Soffa’s core business consists of 140,000 installed systems across 500 customers. Product demand for this group of products is based primarily on global semiconductor unit shipments, with higher capital intensity of the Company’s equipment also affecting the earnings outlook. The macro tailwinds boosting the long-term prospects are the same as will be discussed in the industry analysis below, specifically: smartphone growth and recovery, IoT and low-cost connected devices, 5G rollout, SSD flash memory, cloud & data center. In the short-to-intermediate term, tight capacity throughout the supply chain and increasing packaging complexities provide a positive performance outlook.
New Growth Opportunities
The conversation on Kulicke & Soffa’s growth opportunities starts with Advanced Packaging. This Advanced Packaging business is over and above To that point, the company’s advanced packaging business has been rolled up into this reporting segment. The Company’s AP products include flip-chip (KATALYST), which is currently the dominant advanced packaging methodology, and thermo-compression bonding (“TCB” – APAMA). APAMA and KATALYST have both had some major design wins recently and K&S continues to get new qualifications, the impact of which should start to be seen in FY 2022/2023. Additionally, its Hybrid equipment supports a variety of wafer-level packaging (“WLP”), multi-chip modules (“MCM”), system-in-package (“SiP”), and package-on-package (“PoP”) packaging processes. KLIC is using its dominant position in lagging-edge wire bonding to carve out a leadership position in advanced packaging methods.
Kulicke & Soffa is bullish on the outlook for its Advanced Display end-market, driven by LED unit shipments. Specifically, Advanced Display consists of mini-LED and micro-LED, with the latter not having an impact until mid-2022 at the earliest, but is not currently contemplated in the Company’s model. However, K&S is already executing on miniLED. The Company launched its Pixalux® micro and mini LED product in September 2018 in collaboration with Rohinni, which has access to ~4% of the display market. As a point of reference, Tony Fadell; the inventor of the iPod, co-inventor of the iPhone, and co-founder of Nest Labs, is one of Rohinni’s main investors. After shipping only two units in 2019, K&S generated $40MM in Advanced Display revenue in FY 2020 before reporting $22MM in Q1 2021 alone. The company is on target to achieve its target $80MM of mini-LED revenue in FY 2021, the outlook of which I will discuss below. This segment offers K&S a lot of potential upside; mini and micro-LED annual unit production is expected to approach 500 billion units by 2022. This is in line with the IHS Markit forecast of a 200% CAGR through 2023, resulting in one trillion units.
Since the collaboration with Rohinni is an exclusive agreement, K&S recently acquired Uniqarta to enable next-gen mini and micro-LED solutions, which will be accretive within one year. Uniqarta is a developer of high-precision, ultrafast, laser-based placement technology (“LEAP”); the laser-based approach, as opposed to mechanical pick (PIXALUX), is a superior technology that enables scaling in a high-end/high-volume market. Not only does the Uniqarta acquisition give K&S the opportunity to grow in the LED market outside of its Rohinni relationship, but the technology it acquired is also much more adept to meet the demands of the micro-LED market. Without delving too deep into the details, the Uniqarta laser-based technology is capable of packaging ~1,000 dies per second while PIXALUX is only able to package ~75 dies per second. At a maximum, the mechanical pick approach could package 150 dies per second. This should illustrate how the Uniqarta acquisition offers customers a better product and provides scale for K&S.
The final component of the Company’s growth opportunity is incremental growth in its APS segment, in which K&S has been active in taking market share from ASM Pacific, its main competitor. Greater share of APS revenue is accretive to overall margins, falling through at ~50% as compared to the Company-average 45-46% margins.
Business Outlook
The semiconductor industry is entering a phase of robust secular demand driven by emerging technologies such as 5G, AI, edge computing / IoT, etc. The result is a high degree of confidence among industry participants that the industry will be experiencing consistent year-over-year unit (and pricing) growth for at least the next few years. Companies like K&S playing a critical role in the supply chain will also benefit from the chip and equipment shortages that are expected to persist through mid-2022. The continued evolution of semiconductor assembly techniques and chip complexity will drive demand for Kulicke & Soffa’s Advanced Packaging products. Its Advanced Display business is positioned to capture even a small share of an industry expected to grow at a ~200% CAGR over the next few years.
A common theme on earnings calls for players throughout the semiconductor value chain is increased visibility. This is partially a result of the long equipment lead times, which have extended to 6-9 months. KLIC specifically indicated, and I confirmed, a high level of visibility through 1H 2022 due to backlogs and ongoing order flow. This increased visibility and more stability in future results will be beneficial for the company’s valuation in the market (discussed below).
Management
Corporate Governance – Qualitative Analysis
Management Team – Background, Reputation, and Performance
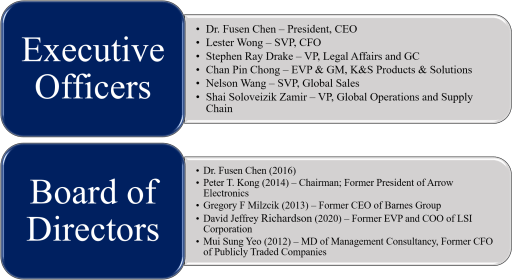
Two of the Company’s directors retired during FY 2020. Brian Bachman had served as a director since 2003 and retired in February 2020. Garret Pierce served as the Chairman and director since 2005 before retiring in September 2020. Jon Olson, a Director on the Boards of Xilinx, Mellanox, InvenSense, and Home Union, was appointed to the Board on March 5, 2021 The Board members have a variety of backgrounds in the semiconductor industry, but also have vast experience in industries outside of chips. It is my view that this dynamic yields diversity of thought, which leads to better decision-making processes. The Board Committee breakdown is as follows:
Fusen Chen, President and CEO
Fusen Chen joined Kulicke & Soffa and has served as the President and CEO since October 31, 2016. Additionally, he was elected to the board of directors on October 3, 2016. Dr. Chen has spent over 30 years in the semiconductor industry, including his first ten years in various management positions at Applied Materials. He previously served as the President and CEO of Mattson Technology, another Semicap company, from 2013 until resigning in order to join K&S. Prior to Mattson he held leadership roles at Novellus Systems, a WFE company. I have not been able to confirm the quote below, however, it says a lot about Dr. Chen’s capabilities and effectiveness (emphasis mine):
Fusen joins K&S from Mattson Technology, Inc. where he was the President and CEO. Under his leadership the company turned around years of losses to generate significant revenue growth and achieved sustained profitability.
sst.semiconductor-digest.com, article on appointment
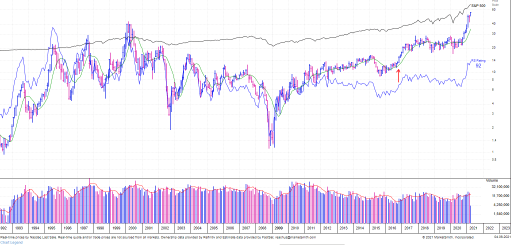
That sounds like a great resume and experience. I will cover profitability and return metrics in the Financial Analysis section below but will focus on shareholder value added here. At first glance, the Company’s stock performance has been lackluster until recently, under Dr. Chen’s leadership. The red arrow indicates when he took over as CEO. Despite trading sideways for years, shareholders have earned a ~40% CAGR since October 2016 given the Company’s recent performance. The Company has also returned a total of $342MM to common shareholders over that time period; $265MM in share buybacks and $77MM in dividends. K&S initiated the common dividend under the current leadership team of $0.12/share in Q4 2018.
Kulicke & Soffa has stated its long-term target is to return 50% of free cash flow to common shareholders in the form of share buybacks and dividends. The Company has exceeded this target over the past five years by returning 85% of FCF. K&S has ~$130MM left in its current share repurchase program and management discusses the plan every 2.5 months at its board meetings. According to the company, “it’s not too hard to get that back up again.” K&S has bought back ~15 million shares since 2014 and that trend seems intact moving forward. Given the anticipated growth spurt in the Semicap industry, I would prefer to see the absolute level of FCF stay muted, with cash flow being allocated to high ROIC investment opportunities. Specifically, continued investment in its Advanced Packaging product lines and carving out a stable position in the Advanced Display market. With that being said, management’s focus on shareholder returns is commendable.
Compensation and Shareholder Alignment
Kulicke & Soffa’s executive compensation program has three main components: base salary, annual performance-based cash incentives, and equity incentives. The entire structure is based on the fundamental principle of “pay-for-performance,” which revolves around four distinct metrics: 1) Net Income (“NI”), 2) Operating Margin (“OM”), 3) relative Total Shareholder Return (“rTSR”), and 4) Organic Growth. My view is that the Compensation Committee has developed a thoughtful structure that prioritizes long-term shareholder alignment with maximizing total company value. The table below reflects the key compensation practices developed by the Company, demonstrating a lot of the best practices I believe should be part of such a program.
Cash-based compensation is based on the Net Income and Operating Margin targets, which are both set at the beginning of a fiscal year by analyzing industry performance and macro industry factors relative to the Company’s operating plan.
Performance-based equity awards (“PSUs”) are based on the rTSR, which captures growth and shareholder value created over a trailing 3-year period. The benefit of this compensation medium is that it adjusts for industry cyclicality or broader economic impacts. As a result, it ensures that management is always incentivized to perform at its best since it will be compensated for outperformance whether it be a cyclical high or low. To mitigate the risk of losing an executive, the Board also has the discretion to grant special equity awards. K&S elaborates on its rationale in the Proxy Statement, identifying three reasons for this structure:
The Compensation Committee believes that total shareholder return relative to an index of companies (GICS Semiconductor Index) in the same industry provides a good measurement to provide alignment between long-term incentive value for the executive team with value created for shareholders.
Vesting is relative to how other management teams and companies in the industry are performing, providing an appropriate benchmark for the executive team.
Provides transparency to shareholders
The Organic Revenue Growth component of executive comp is in place to align with market practice and emphasize the Company’s focus on growth. This metric used for PSU grants, as well, was implemented in 2018 and is calculated by averaging annual revenue growth over the trailing 3-year period (M&A is considered organic after four quarters). The Compensation Committee added a provision to this performance measure that also ensures that management is incentivized in cyclical downturns by allowing a payout from this measure if K&S outperforms its two direct competitors if the organic growth metric is not achieved.
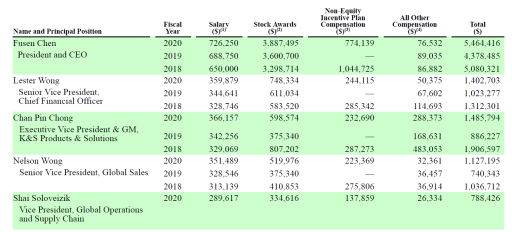
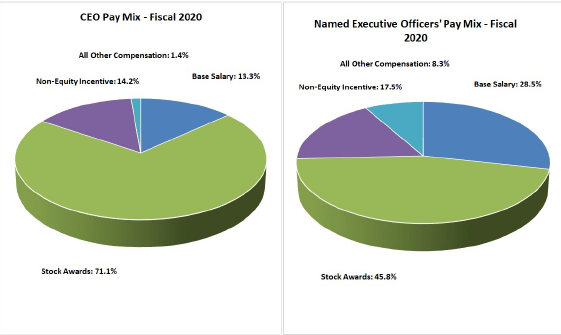
The main thing I focus on is if overall compensation tracks operating and share performance. While the stock traded sideways over 2018 and 2019, operating results in 2018 were superior to 2019 during the trough in the chip market. While 2020 operating performance was still below 2018 levels, the stock had its best year in recent history. The three-year compensation trend seems to reflect these dynamics from a high level. Overall, I believe the Board has developed a compensation structure for executives that align the management team with long-term shareholder value, while also ensuring the Company can build and retain a talented, experienced, and tenured executive management team. Shareholders agree, as 97.5% of shareholders voted in approval of the plan at the 2020 annual meeting (another positive – the Board engages with shareholders to understand their views on the comp structure). I like to see executives have skin in the game, resulting from a large proportion of equity to total compensation. KLIC achieves this goal, as can be seen by stock awards comprising +70% of CEO pay and +45% of pay for other executives.
I was very pleased to read through how thoughtful the committee seems to be when it comes to the overall compensation structure, I highly recommend taking a look to see some high-quality practices. To conclude the evaluation of management, this quote from the 14A sums up the goals and objectives of Kulicke & Soffa’s compensation program:
The Committee structures the executive compensation program to reward executives for performance, to build and retain a team of tenured, seasoned executives by maintaining competitive levels of compensation and to invest in our executives, and in the long-term success of the Company and its shareholders. By adhering to these goals, we believe that the application of our compensation program has resulted in executive compensation decisions that are appropriate and that have benefited the Company and its shareholders over time.
Schedule 14A, Page 21
Insider Buying and Selling
OpenInsider is my source for tracking insider buying and selling. There are only two concerning selling events recently; CFO Lester Wong and EVP Chong Chan Pin sold ~19% and ~20% of their shares, respectively, in early and mid-March 2021. It does not seem to be simply exercising options. Other than these two selling events, nothing substantial seems to be of high importance.
Financial Analysis
I am going to frame the financial analysis through the lens of the Expectations Investing Infrastructure and Competitive Strategic Framework developed by Michael Mauboussin and Al Rappaport in their book, Expectations Investing. I find this appropriate given that it is how I developed the critical factors, which drive the overall investment thesis. Additionally, the framework is the foundational principle of my approach to valuation. I will use a few terms in this analysis that the framework revolves around:
Value Triggers: Fundamental components of value that start the expectations revisions process.
Value Factors: The analytical tools that serve as links between value triggers and value drivers.
Value Drivers: The metrics through which changes in shareholder value can be calculated.
An important note to keep in mind throughout the Financial Analysis and Valuation sections is that I do not believe I can forecast Company performance over a long time horizon with a high level of accuracy. I am able to have confidence in the more near-term estimates as a result of overall visibility. However, trying to make accurate and/or precise longer-term forecasts is a fool’s errand. Too much can go wrong and follow on compounding effects can exacerbate misses. But does this really matter if we are long-term investors and I have short-term benchmarks (critical factors) by which I can measure if my thesis is intact? I don’t think so. It is more important that I can underwrite the directional trajectory of the industry and business, which I think I can do given the extensive due diligence I have performed.
I don’t think it would be helpful to copy and paste the financial statements in this report, these can be easily downloaded. I will discuss historical items that are relevant to figuring out the Company’s prospects. I will include a quick review of metrics I believe to be critical to the analysis and valuation. However, I have included a full tab of metrics in the model for your review if you would like to see granular details. Before diving in, I wanted to share the company’s 2021 business model:
– Core Revenue: $800-850MM – $700-$750MM baseline plus $100MM due to capital intensity; based on 6.5% annual chip growth
– LED: $80MM-$100MM of miniLED (general lighting included in Core)
– “Normalized Memory and Auto”: $40MM – While no specific guidance was provided, the indication was a return to historical levels. The real upside is a rebound in the Auto end-market, which gives me a little more than $40MM of incremental revenue
– Incremental Volume: $100MM – This is the upside in the model and how the Company guided to $1.1B in revenue. The rationale was based on estimated 12% unit growth. So, doing rough math gets to about $18MM of incremental revenue for every 1% unit growth above 6.5%. This is not a hard and fast rule, but something we can anchor to and adjust as time elapses.
Revenue
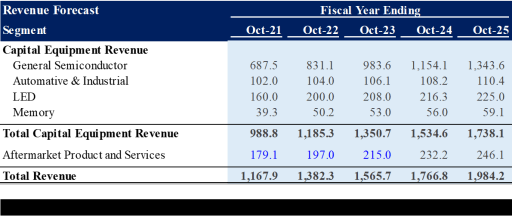
Revenue is the primary value trigger that is responsible for the majority of revisions to expectations, which are the catalysts for stocks to move higher. The component factors are volume and price & mix, both of which inform the Company’s sales growth rate – the value driver. A snapshot of forecast revenue can be seen here, for more detail you should reference the associated financial model.
Volume
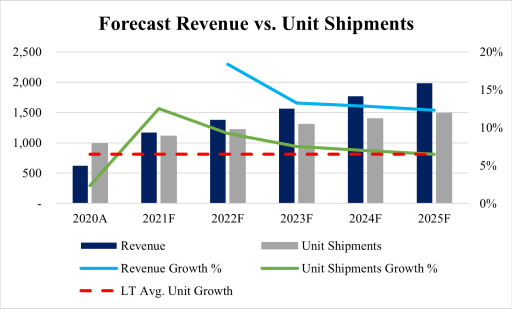
Volume is driven by two dynamics: industry growth and market share. The strong relationship between KLIC’s revenue and industry unit shipments can be seen in the chart provided in the Business Overview. Semiconductor unit shipments are the volume driver for KLIC and the macro metric that I use to forecast future sales growth of the Company’s core business. The company has stated and demonstrated that its core business revenue baseline is $800-$850MM, a forecast based on an assumption of 6.5% annual growth in chip shipments. Additionally, there is a ~57% correlation between revenue and unit shipments. As a result, I can flex this revenue base around forecasted unit shipments obtained from industry sources and my own view of mean reversion. Industry insiders are expecting over 12% chip growth in 2021, nearly double the assumption driving the Company’s base revenue model. [Note: The updated industry forecast from ICInsights reports forecast 2021 unit growth of 13.4%] K&S has visibility through “at least mid-2022” due to current equipment lead times of 6-9 months, providing less variability in near-term quarterly forecasts. This is important to understand for the directional trajectory of overall revenue and company performance.
While I drive forecasted revenue of overall semiconductor unit shipments, I do not give the Company any upside for its plan to capture LED market share over and above its agreement with Rohinni. This relationship has visibility, whereas the Company’s plans to take market share in micro-LED through its Uniqarta acquisition is more speculative. As mentioned above, LED unit shipments are expected to exceed a 200% CAGR over the next few years. If K&S captures just a sliver of that growth then there may be reasonable upside above what is reflected in the model. The inflection point in 2023 when I expect IC shipments to revert back to the Company’s LT forecast is when the LED business could ramp up. It’s an opportunity I will continue to think through; however, I am only giving K&S benefit for its in-place miniLED business with Rohinni. I do not grant them any upside from its acquisition of Uniqarta, hopefully, this is juice for forward revisions. As it stands, the forecast reflects a 14% and 7.6% CAGR in Total Revenue and semiconductor unit shipments, respectively. The spread is discussed below. The chart below excludes the forecasted 2021 revenue growth estimate of 87% since it skewed the visual value of the chart.
Price and Mix
Industry volume growth provides high visibility for the Company’s performance through mid-to-late 2022. However, during that time and beyond, the Company’s product mix provides sustainability in forecast revenue growth. A component of the spread in growth rates reflected in the revenue forecast above is the higher estimated capital intensity, as well as the $250MM of incremental revenue from new growth opportunities. Turning to the revenue from these new growth opportunities, this will all be ~50% gross margin business flowing through to the bottom line. Since Core Business and New Growth Opportunities are combined in the reportable segments, I will provide more clarity on the base-case $250MM revenue here:
Advanced Packaging: $80MM by 2023; resulting from market adoption of flip-chip, TCB, and Hybrid bonders.
Mini (Potentially Micro) LED – Advanced Display: $110MM by 2022; crosswalk to the LED segment, Advanced Display is currently 50% of the overall LED segment. I forecast a slightly higher mix towards this Advanced Business, resulting in the $200MM 2022 forecast.
APS: $40MM of incremental APS revenue by 2023 resulting from market share gains and continued shipment growth; resulting in the $215MM forecast.
Higher capital intensity, driven by the increased usage of its equipment for multi-die rather than single-die packages, will also drive both higher prices and margins. This dynamic is captured in “Core Business” line. Another near-term tailwind is the recovery in Auto & Industrial, of which K&S serves roughly 150 OEMs. The equipment K&S sells to the automotive end market is of higher-performance quality, yielding higher margins, and is a much stickier product line due to the stringent qualification process. The higher-performance equipment includes the wedge bonders, for reliability, and equipment for internal lighting displays. The Company expects a $25MM-$30MM revenue run rate for this segment, which is consistent with historical trends. However, this could be vastly underestimating the opportunity given forecasted increases in silicon content and spend. I will let this remain as revenue and margin upside. Further details around the revenue forecast can be found in the model.
Operating Profit Margin / Operating Costs
The discussion on Price and Mix also informs the expected improvement in operating margins. The next iteration of the Company’s model reflects a $1.2B revenue baseline and 24%-25% operating margins. The operating margin is consistent with how I have modeled out the revenue and expense structure. Leverage in the model results from a larger shift towards LED and Advanced Packaging, while supported further by market share gains in its APS segment. So, the incremental ~$250MM in revenue from new growth opportunities that KLIC is targeting will yield superior margins and fall-through to the bottom-line above the historical corporate average. K&S insists that it can maintain an expense structure based on $53MM of fixed costs and 5-7% of variable costs per quarter; variable costs are inversely related to sales volumes. The Company’s Q2 2020 expense guidance is $76MM. Doing the math, this reflects $23MM of variable expenses or ~7.6% of revenue. The Company stated this is “on the high side. That’s basically full-on variable, right? We’re full-on. Incentive compensation is like 200% this year, we’re sort of maxed out. It’s not going to happen again next year.“
On higher revenue periods, we should theoretically be on the lower side of that variable, right? So it’s, it’s more of really on a hundred twenty million dollar quarter, you know, we’re gonna be at seven percent (variable), on a $300 million quarter we should be at like, we should really be at five (percent variable).
Company IR, Context Added by Me
Moving to the expense line items, K&S is committed to maintaining between 16%-20% Research & Development expense margins. Continued investment in developing cutting-edge equipment to meet the assembly needs of its customers is critical to the Company being able to maintain and continue to take market share. This is a trend I maintain in the outer years. The model then plugs G&A expenses for the total quarterly or annual expenses based on the $53MM inflation-adjusted fixed costs and 5-7% variable costs. I anticipate and model the Company meeting its 2023 target Operating Margin of 24%-25% due to the aforementioned leverage in the business model.
Looking at the historical trends would lead one to see this forecast as optimistic, to say the least. However, the Company has only now achieved a +$1B revenue run rate in Q1 2021, which is the baseline for K&S achieving +20% margins. This checks out, as EBIT Margin in Q1 2021 was 20.2%. Building out this model forward reveals the benefits of the company’s scale.
Investments
While Revenue drives firm growth and is the primary source of changes in company expectations, investment decisions are the real driver behind future value creation. I will touch on this in the Valuation section. There are two different categories of investments: working capital and fixed capital.
Working Capital
At a high level, K&S working capital has fluctuated between 16%-30% of Revenue. The conversation really revolves around AR, Inventory, and AP – the three accounts drive the Company’s working capital needs and provide insight into short-term cash needs. The cash conversion cycle can be seen in the Model tab in rows 216-219. Overall, the Company’s net operating cycle looks to average around 150 days. However, this has come down to roughly 100 days in the current environment given the power position KLIC is in right now.
Accounts Receivable: The Company’s collection trends are also tied to the broader industry cycle. In favorable markets (see Q1’21 or FY 2016 & 2017), the Company can collect its receivables between roughly 75 and 90 days after sales are made. However, in unfavorable markets, the collection period increases to between 100 and 120 days. This is the worst DSO of the chip equipment companies that I have reviewed (albeit not a full review of all companies, to be candid). This leads me to believe that the Company is either too lenient with its customers or customers have too much power over KLIC. Regardless, it is a significant drain on cash and use of resources.
Inventory: See the comments above on AR. The same dynamic can be seen in inventory. Of course, inventory levels have come down substantially due to the high demand for its equipment and the associated lead times. I would expect to see further compression in this account through the rest of the year given how tight the market is.
Accounts Payable: To the contrary of how KLIC manages its capital usage for AR and inventory, K&S is able to extend payment timing to its suppliers. A DPO of ~55-60 days provides a little relief to the cash drain from its AR and inventory management.
Kulicke & Soffa’s incremental working capital need is historically highly variable. However, I take a somewhat conservative view of the company’s operating capital needs by assuming roughly 20% additional working capital to fund $1 of sales.
Fixed Capital
The company has historically invested between 2.0%-3.5% of revenue in fixed capital, the majority of which is for the machinery and equipment used to build the machines that are then sold to its end customers. Once again, historical incremental net fixed capital investment (CapEx-Depreciation) is highly variable due to sales variability. However, I am forecasting roughly 10% incremental net fixed capital investments resulting from investing ~2.5% of revenue into CapEx.
Other Financial Analysis
Income Statement
An important assumption I am making revolves around operating leverage in the business model over and above the $1B revenue run rate. This statement by management was confirmed in Q1 2021, as operating expense margins fell from ~40% on average to 25% in the most recent quarter. The follow-through resulted in a 20% operating margin despite a slightly lower than average gross margin. This leverage is a core part of the thesis and must be tracked quarterly and annually.
Balance Sheet
Focusing first on Liquidity Ratios, Kulicke & Soffa continues to have a sufficient buffer for its short-term funding requirements. Its Current, Quick, and Cash Ratios have averaged around 5.5x, 4.5x, and 3.5x historically, respectively. While these levels have come down modestly in the most recent quarter, K&S maintains sufficient net operating assets to fund the business. Pivoting to long-term accounts, KLIC has a clean Balance Sheet reflected by a Total Debt / Equity ratio of just 5%. K&S has the optionality of obtaining bank debt or issuing debt to fund investment opportunities, which would create a more efficient capital structure in my view. There’s no need to discuss the Company’s solvency.
Profitability
Starting first with a measurement of management’s ability, KLIC has consistently translated ROA into higher ROE. However, both metrics have been lackluster over the past three or four years. On a positive note, both measures ticked much higher in Q1 2021 as performance resulted in ROA and ROE of 16.7% and 23.7%, respectively. I am modeling out relatively consistent performance moving forward.
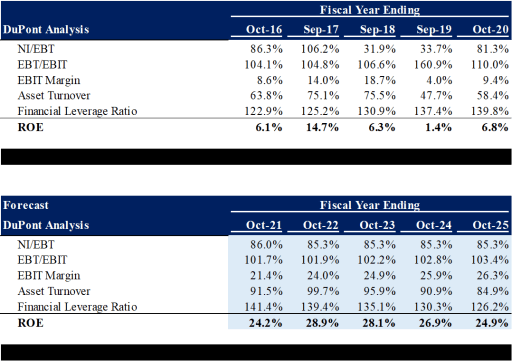
Analyzing the component buildup of the Company’s return on equity makes it evident that EBIT margin is the core driver of the company’s profitability. This analysis is why operating margin % is one of the value drivers of my thesis. Walking through the analysis, don’t get confused by the fall-off in the company’s tax burden in 2018 and 2019 (NI/EBT). The Company’s effective tax rate of 68% and 66%, respectively, was mostly a result of one-time taxes incurred on repatriated profits. The long-term tax rate for K&S should be ~18%, which is why the forecasted tax burden is closer to the 2020 levels.
The interest burden (EBT/EBIT) is roughly 1.0 given that K&S has little-to-no debt. Before analyzing the EBIT margin and Asset Turnover, Financial Leverage is expected to remain relatively constant since I am not modeling any significant changes in the Company’s cap structure. The forecasted EBIT Margin has been discussed in-depth in this write-up, as the forecasted margin reflects leverage in the Company’s business model moving forward. The overall improvement and consistent Asset Turnover is a result of forecasting a net operating cycle that is consistent with recent performance. To be clear, this means I am anticipating lower levels of AR and inventory as K&S is better positioned with its customers and inventory levels should stay modest as lead times remain elevated. This is an area I anticipate looking into more deeply.
Valuation
Competitors
Kulicke & Soffa primarily competes with ASM Pacific Technology (“ASM”) (0522.HK), BE Semiconductor Industries (“BESI”) (BESI.AS), and Shinkawa Ltd. in the semiconductor equipment and packaging materials market. Shinkawa is a private company; however, I will utilize ASM and BESI in an analysis of comparable companies. In packaging materials, K&S competes with PECO, Disco Corporation (TYO: 6146), Small Precision Tools, and Chaozhou Three-Circle Group.
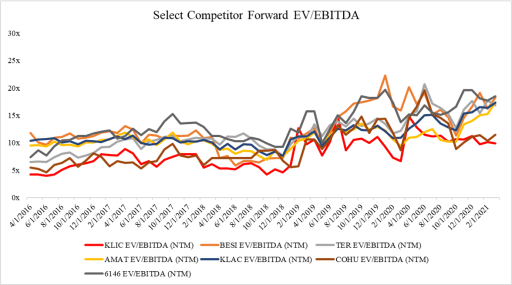
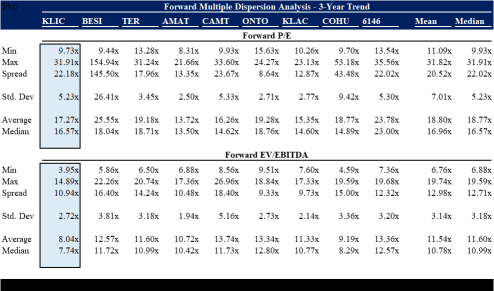
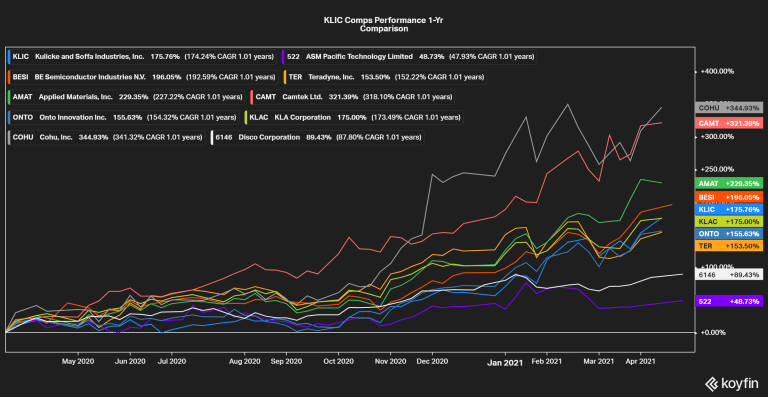
The trading multiples above are based on LTM metrics, the following graphic comparisons will include forward multiples. The green highlighted metrics denote where Kulicke & Soffa was “better” than the median; meaning its multiples were lower than the median and growth metrics were higher. Note that KLIC still trades at multiples lower than median comps even after a 20% move in the stock since I sent out the initial report on March 26th. It is evident that Kulicke & Soffa has been one of the top performers in the competitor group over the past twelve months, another indication of the Company’s strong momentum.
ASM Pacific and BESI are the Company’s two primary direct competitors, with BESI entering the assembly equipment space following its acquisition of ESEC in 2009. ASM is the primary competitor across wire bonding, die-attach, etc.; however, KLIC dominates the higher-end of the wire bonding market and is the primary vendor for the major OSATs. ASM’s Semiconductor Solutions segment is slightly larger than KLIC but after studying ASM, it seems to be due to broader product categories (thus, higher volume). ASM is growing slower than KLIC based on 2020 results, which corroborates KLIC’s leadership position in the industry identified by participants. The Gross Margin picture also tells two stories when compared to KLIC. First, it confirms that ASM competes more in the lower-end wire bonding market, given that KLIC’s margin is conservatively 600 basis points higher than ASM. Second, while KLIC has been consistently growing Gross Margin, including a ~70 bps improvement in FY 2020 over FY 2019, ASM’s Gross Margin compressed by 43 bps in FY 2020. My review of ASM gave me additional confidence in KLIC’s dominant position in the space. KLIC continues to invest ~18%-20% of Revenue into R&D while ASM only invests ~11% in the same; I expect KLIC to maintain this dominant position moving forward. The remaining competitors aside from Disco Corporation are semiconductor equipment manufacturers that have products used in the assembly and packaging process.
Market Multiple Trends
I will not spend a lot of time talking about multiples since they are more of an output than an input to valuation; however, it is helpful in framing the discussion especially in a historical context. This discussion will revolve around forward multiples; the market discounts the future, not the past.
The immediate takeaway is that KLIC is trading at lower forward multiples than its competitors. Certainly, no need for me to elaborate on a pretty self-explanatory table. This could certainly be a result of poor performance compared to the broader group. But this is not the case, as can be seen below. Rather, it is a result of the market not yet catching up to forward estimates that have been revised upward following the Company’s massive beat and higher guidance visibility following its latest earnings report.
Kulicke & Soffa’s stock has been outperforming over the past few weeks. However, zooming out reveals performance in the middle of the pack among its peers. While ASM’s historical multiples were not available, the stock’s performance says a lot about its performance and competitive positioning. This is another data point to supplement the competitor analysis above; Kulicke & Soffa is the better company and investment opportunity. The discount K&S currently trades at relative to its peers coupled with the modest relative performance sets up the stock to outperform moving forward.
Price-Implied Expectations (“PIE”)
I anticipate appropriately presenting the PIE framework to stock analysis through this newsletter at some point. However, for any questions in the interim, feel free to reach out with any questions and/or buy the book (link above)! My view is that there is no better framework to anchor to as a core valuation tool. To summarize in my less eloquent way, the PIE approach to valuation is based on the fundamental principle that changes in stock price and/or shareholder return is dependent on changes in expectations about the firm’s future cash flows. I often posit this question to people – how can I forecast a company’s business with a high degree of accuracy when I can’t even forecast what my bank account will look like in a year when I am the expert of my bank account?
Then what is the answer? Figure out what expectations the market is currently pricing into the stock and determine if that is reasonable or not. The principle analysis centers around whether or not the present value of a company’s net operating profits after taxes (“NOPAT”) is greater than the incremental investment. Said differently, can the company generate a return on incremental invested capital greater than its cost of capital? This fundamental equation determines whether or not growth adds or destroys value. The implications for a financial analysis should now be evident: for a given change in sales growth expectations, the operating profit margin determines the impact on shareholder value. So, the operating margin has a certain value breakeven value, which Maubaussin and Rappaport refer to as the threshold margin. The company adds shareholder value when the operating margin is in excess of the threshold margin. I can sense myself about to go on an elaborate rant on stock market value theory, I love this stuff, so I am going to stop myself. Rather, the focus needs to be on how to interpret this analysis – what indicates a buying opportunity?
I want to see 1) what is the stock price’s percentage discount to the expected value (the “margin of safety”) and 2) how long it will take for the market to revise its expectations. The analysis for the former is straightforward: the greater the discount to the expected value, the higher the prospective excess return, the more attractive the opportunity. The latter component is intuitive – the sooner a stock price is expected to converge on its higher expected value, the greater the probable excess return. The last piece I want to touch on is the “market-implied forecast period” (“MIEF”) – also known as “value growth duration” and “competitive advantage period”. This calculation indicates the number of years of FCF generation that is required to justify the current stock price. An alternative interpretation is how long the market expects the company to be able to generate returns that exceed its cost of capital. Empirically, the MIEF for U.S. stocks averages 10-15 years; but can range from zero to as long as 30 for companies with strong competitive positions. So, if the MIEF is less than your estimate of the amount of time a company will continue to generate ROIIC > Cost of Capital, that represents a buying opportunity.
Remember that buying opportunities do not depend on the absolute level of company performance or investor expectations, but rather on your expectations relative to price-implied expectations.
Expectations Investing, Page 111
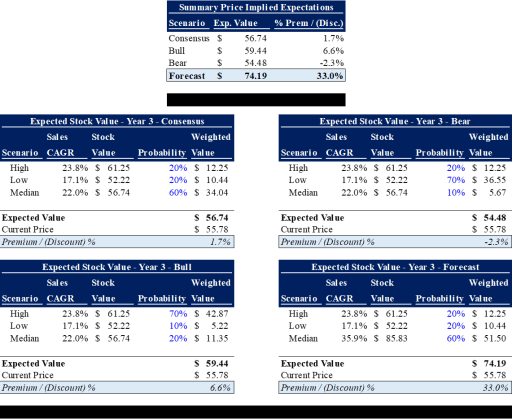
Mechanically what I am going to do is analyze the projected stock price based on different market expectations or scenarios: High, Low, Median, and Mean. You can think of this as the Bull, Bear, and Base (Consensus) case forecasts in the market. Based on my view of the probabilities of these outcomes, I will calculate the weighted average value of these scenarios. This is the expected value which I will then compare to the current stock price. Finally, something I have learned is that an investor does not necessarily need to have a differentiated view from the market. If there is high variability in the expected value under the different scenarios, it is possible that a stock presents an attractive buying opportunity even if the consensus is the most likely outcome.
Note that the “Forecast” scenario is the output of my bottom-up model. The stock prices were obtained as of year 3 since that is as far as I could find consensus estimates. There are some very important takeaways from this analysis:
Consensus: In my initial write-up, the core of my thesis – the very first sentence of my view – was, “The current stock price is ~28% undervalued if the consensus outcomes is the highest probability scenario.” This was why I invested in KLIC: the stock was trading at a substantial discount to the expected value based on consensus estimates (see #1 of buying opportunity indicators above). That is why I wanted to get this in front of you all ASAP; after doing all my homework and analyzing expectations for the stock, I felt it was an opportune buying opportunity. This is a helpful case study – there will always be opportunities out there. In regards to the timing of the move in the stock, I have no clue why the price moved as fast and as soon as it did. But I believe the original thesis was correct, there was an anchoring effect in the market and the stock price had not adjusted appropriately.
Forecast: The thesis is no longer a layup, but is still very strong for me. I am highly confident the market is still underestimating the company’s visibility through 2022, which I believe is the core value trigger. However, the market is also missing the sustainable operating leverage in the company’s model. I have no issue with the conservative 20% estimates for FY 2021 and 2022, but the 200 bps decline in 2023 will prove to be a drastic underestimation. Allocating the scenario probabilities indicated in the lower-left quadrant (“Forecast Scenario”) results in 33% for the stock relative to the current price.
Market-Implied Forecast: You can see the results in cell E41 in the model. The current consensus median estimate implies a competitive advantage period of less than a year because the valuation based on consensus 2021 cash flow is greater than the current price (albeit barely). Is Kulicke & Soffa going to lose its dominant position in the assembly equipment market this year, in which lead times for its equipment have extended to 6-9 months and the company has visibility through mid-2022? I don’t think so. This is another indication of an undervalued stock.
Part II will contain a full Industry overview.

